What’s New
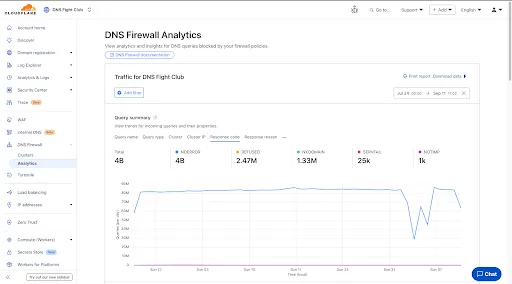
Access GraphQL-powered DNS Firewall analytics directly in the Cloudflare dashboard.

Explore Four Interactive Panels
- Query summary: Describes trends over time, segmented by dimensions.
- Query statistics: Describes totals, cached/uncached queries, and processing/response times.
- DNS queries by data center: Describes global view and the top 10 data centers.
- Top query statistics: Shows a breakdown by key dimensions, with search and expand options (up to top 100 items).
Additional features:
- Apply filters and time ranges once. Changes reflect across all panels.
- Filter by dimensions like query name, query type, cluster, data center, protocol (UDP/TCP), IP version, response code/reason, and more.
- Access up to 62 days of historical data with flexible intervals.
Availability
Available to all DNS Firewall customers as part of their existing subscription.
Where to Find It
- In the Cloudflare dashboard, go to the DNS Firewall page.
- Refer to the DNS Firewall Analytics to learn more.
Source: Cloudflare
Latest Posts
- Amazon GameLift Servers expands instance support with next-generation EC2 instance families

- (Updated) Microsoft 365 Copilot: Customize how managers are identified in Workforce Insights agent and Copilot responses [MC1260710]
![(Updated) Microsoft 365 Copilot: Customize how managers are identified in Workforce Insights agent and Copilot responses [MC1260710] 3 pexels kuan yu huang 252427105 32459953](data:image/svg+xml;base64,PHN2ZyB3aWR0aD0iMSIgaGVpZ2h0PSIxIiB4bWxucz0iaHR0cDovL3d3dy53My5vcmcvMjAwMC9zdmciPjwvc3ZnPg==)
- (Updated) Microsoft 365 Copilot: Create and view Outlook rules [MC1223821]
![(Updated) Microsoft 365 Copilot: Create and view Outlook rules [MC1223821] 4 pexels rostislav 5011647](data:image/svg+xml;base64,PHN2ZyB3aWR0aD0iMSIgaGVpZ2h0PSIxIiB4bWxucz0iaHR0cDovL3d3dy53My5vcmcvMjAwMC9zdmciPjwvc3ZnPg==)
- (Updated) Microsoft 365 Copilot: Email triage with pin, flag, archive, and mark read [MC1193695]
![(Updated) Microsoft 365 Copilot: Email triage with pin, flag, archive, and mark read [MC1193695] 5 pexels kinkate 368260](data:image/svg+xml;base64,PHN2ZyB3aWR0aD0iMSIgaGVpZ2h0PSIxIiB4bWxucz0iaHR0cDovL3d3dy53My5vcmcvMjAwMC9zdmciPjwvc3ZnPg==)


![(Updated) Microsoft 365 Copilot: Customize how managers are identified in Workforce Insights agent and Copilot responses [MC1260710] 3 pexels kuan yu huang 252427105 32459953](https://mwpro.co.uk/wp-content/uploads/2025/06/pexels-kuan-yu-huang-252427105-32459953-150x150.webp)
![(Updated) Microsoft 365 Copilot: Create and view Outlook rules [MC1223821] 4 pexels rostislav 5011647](https://mwpro.co.uk/wp-content/uploads/2024/08/pexels-rostislav-5011647-150x150.webp)
![(Updated) Microsoft 365 Copilot: Email triage with pin, flag, archive, and mark read [MC1193695] 5 pexels kinkate 368260](https://mwpro.co.uk/wp-content/uploads/2024/08/pexels-kinkate-368260-150x150.webp)

![Microsoft Copilot Studio – Upgraded support for Adaptive Cards in Copilot Studio [Update} [MC1126842] 8 Microsoft Copilot Studio – Upgraded support for Adaptive Cards in Copilot Studio [Update} [MC1126842]](https://mwpro.co.uk/wp-content/uploads/2024/08/pexels-rquiros-2330137-150x150.webp)